flowchart LR
    subgraph Sources["📥 Data Sources"]
        PBI["📊 Power BI<br/>Semantic Models"]
        SSB["🏛️ Nordic Statistics<br/>SSB/SCB/DST"]
        PAR["📦 Parquet<br/>Columnar Data"]
        CSV["📄 CSV<br/>Text Files"]
    end

    subgraph Processing["⚙️ Processing Engine"]
        DUCK["🦆 <b>DuckDB</b><br/>SQL Analytics"]
    end

    subgraph Outputs["📤 Output Formats"]
        XLSX["📗 Excel"]
        DOCX["📘 Word"]
        PPTX["📙 PowerPoint"]
        CSVOUT["📄 CSV"]
        JSON["🔧 JSON"]
        PARQ["📦 Parquet"]
    end

    PBI --> DUCK
    SSB --> DUCK
    PAR --> DUCK
    CSV --> DUCK

    DUCK --> XLSX & DOCX & PPTX
    DUCK --> CSVOUT & JSON & PARQ

    style PBI fill:#f59e0b,color:white,stroke:#d97706
    style SSB fill:#3b82f6,color:white,stroke:#1e40af
    style PAR fill:#8b5cf6,color:white,stroke:#7c3aed
    style CSV fill:#06b6d4,color:white,stroke:#0891b2
    style DUCK fill:#10b981,color:white,stroke:#059669,stroke-width:3px
    style XLSX fill:#059669,color:white
    style DOCX fill:#059669,color:white
    style PPTX fill:#059669,color:white
7 Data Automation & File I/O
TipWhat You’ll Learn
Master the art of automating clerical work: extract data from Power BI, transform it with DuckDB SQL, and generate professional Excel reports, Word documents, and PowerPoint presentations—all through natural language.
7.1 The Automation Opportunity
As a brand manager, you spend hours on repetitive data tasks:
| Task | Manual Time | With MCP |
|---|---|---|
| Export Power BI data to Excel | 10-15 min | 30 seconds |
| Create monthly sales report | 2-3 hours | 5 minutes |
| Build quarterly presentation | 4-6 hours | 15 minutes |
| Combine data from multiple sources | 1-2 hours | 2 minutes |
“Extract last quarter’s sales by region, create a pivot table, and generate a PowerPoint summary.”
One prompt. Three deliverables. No clicking.
7.2 MCP File I/O Capabilities
7.2.1 Data Sources & Formats
7.2.2 Tool Overview
| MCP Server | Read From | Write To | Special Features |
|---|---|---|---|
| Power BI MCP | Semantic models | CSV, Excel | DAX queries, real-time data |
| MCP Stats | Parquet, CSV | Parquet, CSV, Excel, JSON | DuckDB SQL, aggregations |
| MCP Stats | — | Word documents | Charts, tables, TOC |
| MCP Stats | — | PowerPoint | Themes, KPI cards, charts |
7.3 Case Study 1: Power BI to Excel Export
7.3.1 The Scenario
You need to send Vinmonopolet your monthly sales data in Excel format. Previously this meant:
- Open Power BI Desktop
- Navigate to the table
- Copy data manually
- Paste into Excel
- Format the spreadsheet
- Save and email
Now it’s one prompt.
7.3.2 The Solution
7.3.3 How It Works
Step 1: Query Power BI
DAX Query
EVALUATE
SUMMARIZECOLUMNS(
    Products[Product Name],
    Geography[Region],
    Calendar[Year Quarter],
    "Total Sales", SUM(Sales[Sales Amount]),
    "Units Sold", SUM(Sales[Quantity])
)
Step 2: Export to Excel
The Power BI MCP Server’s query_to_file action handles this directly:
{
  "action": "excel",
  "modelName": "Norway Analytics/Sales VP Belmonte",
  "query": "EVALUATE SUMMARIZECOLUMNS(...)",
  "outputPath": "D:\\Reports\\Q4_Sales.xlsx",
  "sheetName": "Q4 Sales Data"
}
TipOutput Formats Available
- csv — Fast, universal, great for data pipelines
- excel — Formatted headers, auto-filter, business-friendly
- parquet — Compressed, columnar, ideal for large datasets
- json — Data interchange, API consumption
7.4 Case Study 2: Working with Parquet Files
7.4.1 Why Parquet?
Parquet is the gold standard for analytical data:
| Feature | CSV | Excel | Parquet |
|---|---|---|---|
| File size (1M rows) | ~500 MB | ~800 MB | ~50 MB |
| Read speed | Slow | Slower | 10-100x faster |
| Column selection | No | No | Yes (read only needed columns) |
| Data types | Lost | Partial | Preserved |
| Compression | None | None | Built-in |
7.4.2 Querying Parquet with DuckDB
The MCP Stats server uses DuckDB for lightning-fast SQL queries:
DuckDB Query
SELECT
    region,
    product_name,
    SUM(revenue) as total_revenue,
    RANK() OVER (PARTITION BY region ORDER BY SUM(revenue) DESC) as rank
FROM data
GROUP BY region, product_name
QUALIFY rank <= 10
ORDER BY region, rank
7.4.3 Aggregations Without SQL
Don’t know SQL? No problem:
{
  "tool": "data",
  "action": "aggregate",
  "paramsJson": {
    "path": "D:\\Data\\transactions.parquet",
    "column": "amount",
    "operation": "median",
    "group_by": "month",
    "where": "year = 2025"
  }
}
Available operations: sum, avg, min, max, count, median, stddev, variance
7.5 Case Study 3: Automated Word Reports
7.5.1 The Monthly Report Problem
Every month you create the same report: - Executive summary - Sales by region table - Trend chart - Recommendations
Let’s automate it.
7.5.2 Document Structure
flowchart TD
    subgraph Setup["🛠️ Document Setup"]
        A["📄 Create Document"]
        B["📝 Header & Footer"]
    end

    subgraph Structure["📋 Report Structure"]
        C["🎯 Title Page"]
        D["📑 Table of Contents"]
        E["📊 Executive Summary"]
    end

    subgraph Content["📈 Data Content"]
        F["📋 Data Tables"]
        G["📊 Charts & Visuals"]
        H["💡 Recommendations"]
    end

    subgraph Finish["✅ Complete"]
        I["💾 Save Document"]
    end

    A --> B --> C --> D --> E --> F --> G --> H --> I

    style A fill:#3b82f6,color:white
    style E fill:#8b5cf6,color:white
    style G fill:#f59e0b,color:white
    style I fill:#10b981,color:white,stroke:#059669,stroke-width:3px
7.5.3 Available Document Elements
| Element | Description | Parameters |
|---|---|---|
| Heading | Section headers (H1-H6) | text, level, alignment, color |
| Paragraph | Body text | text, bold, italic, fontSize |
| Table | Data tables | dataJson, style (grid/striped/elegant) |
| List | Bullet or numbered | items, numbered |
| Chart | Bar, line, pie, etc. | chartType, dataJson, title |
| Image | Pictures/logos | imagePath, width, caption |
| Divider | Horizontal lines | color, thickness |
| TOC | Table of contents | maxLevel |
7.5.4 Themes Available
- Professional — Deep navy, formal
- Corporate — Dark blue, business
- Modern — Charcoal with red accents
- Academic — Forest green, scholarly
- Minimal — Black and gold, elegant
7.6 Case Study 4: PowerPoint Generation
7.6.1 From Data to Presentation
7.6.2 Visual Components
The MCP Stats PowerPoint generator includes modern visual elements:
| Component | Use Case | Example |
|---|---|---|
| Big Number | KPI highlights | “$2.4M Revenue” |
| Content Card | Boxed content with shadow | Key insights |
| Statistics Grid | 2x2 or 3x3 KPI layout | Dashboard slides |
| Accent Bar | Visual hierarchy | Section dividers |
| Shapes | Arrows, callouts, icons | Flow diagrams |
7.6.3 Theme Showcase
Code
import matplotlib.pyplot as plt
import matplotlib.patches as patches

themes = {
    'Professional': ['#1C2833', '#566573', '#ABB2B9', '#EAECEE'],
    'Corporate': ['#1a365d', '#2c5282', '#4299e1', '#ebf8ff'],
    'Modern': ['#292929', '#E33737', '#F5F5F5', '#666666'],
    'Creative': ['#5EA8A7', '#FE4447', '#FFE66D', '#4ECDC4'],
    'Minimal': ['#000000', '#BF9A4A', '#FFFFFF', '#F5F5F5'],
    'Startup': ['#F96D00', '#393E46', '#222831', '#EEEEEE']
}

fig, axes = plt.subplots(2, 3, figsize=(12, 6))
axes = axes.flatten()

for idx, (theme_name, colors) in enumerate(themes.items()):
    ax = axes[idx]
    for i, color in enumerate(colors):
        rect = patches.Rectangle((i*0.25, 0), 0.25, 1,
                                   linewidth=1, edgecolor='white',
                                   facecolor=color)
        ax.add_patch(rect)
    ax.set_xlim(0, 1)
    ax.set_ylim(0, 1)
    ax.set_title(theme_name, fontsize=12, fontweight='bold')
    ax.axis('off')

plt.suptitle('Available PowerPoint Themes', fontsize=14, fontweight='bold', y=1.02)
plt.tight_layout()
plt.savefig('images/pptx-themes.png', dpi=150, bbox_inches='tight', facecolor='white')
plt.show()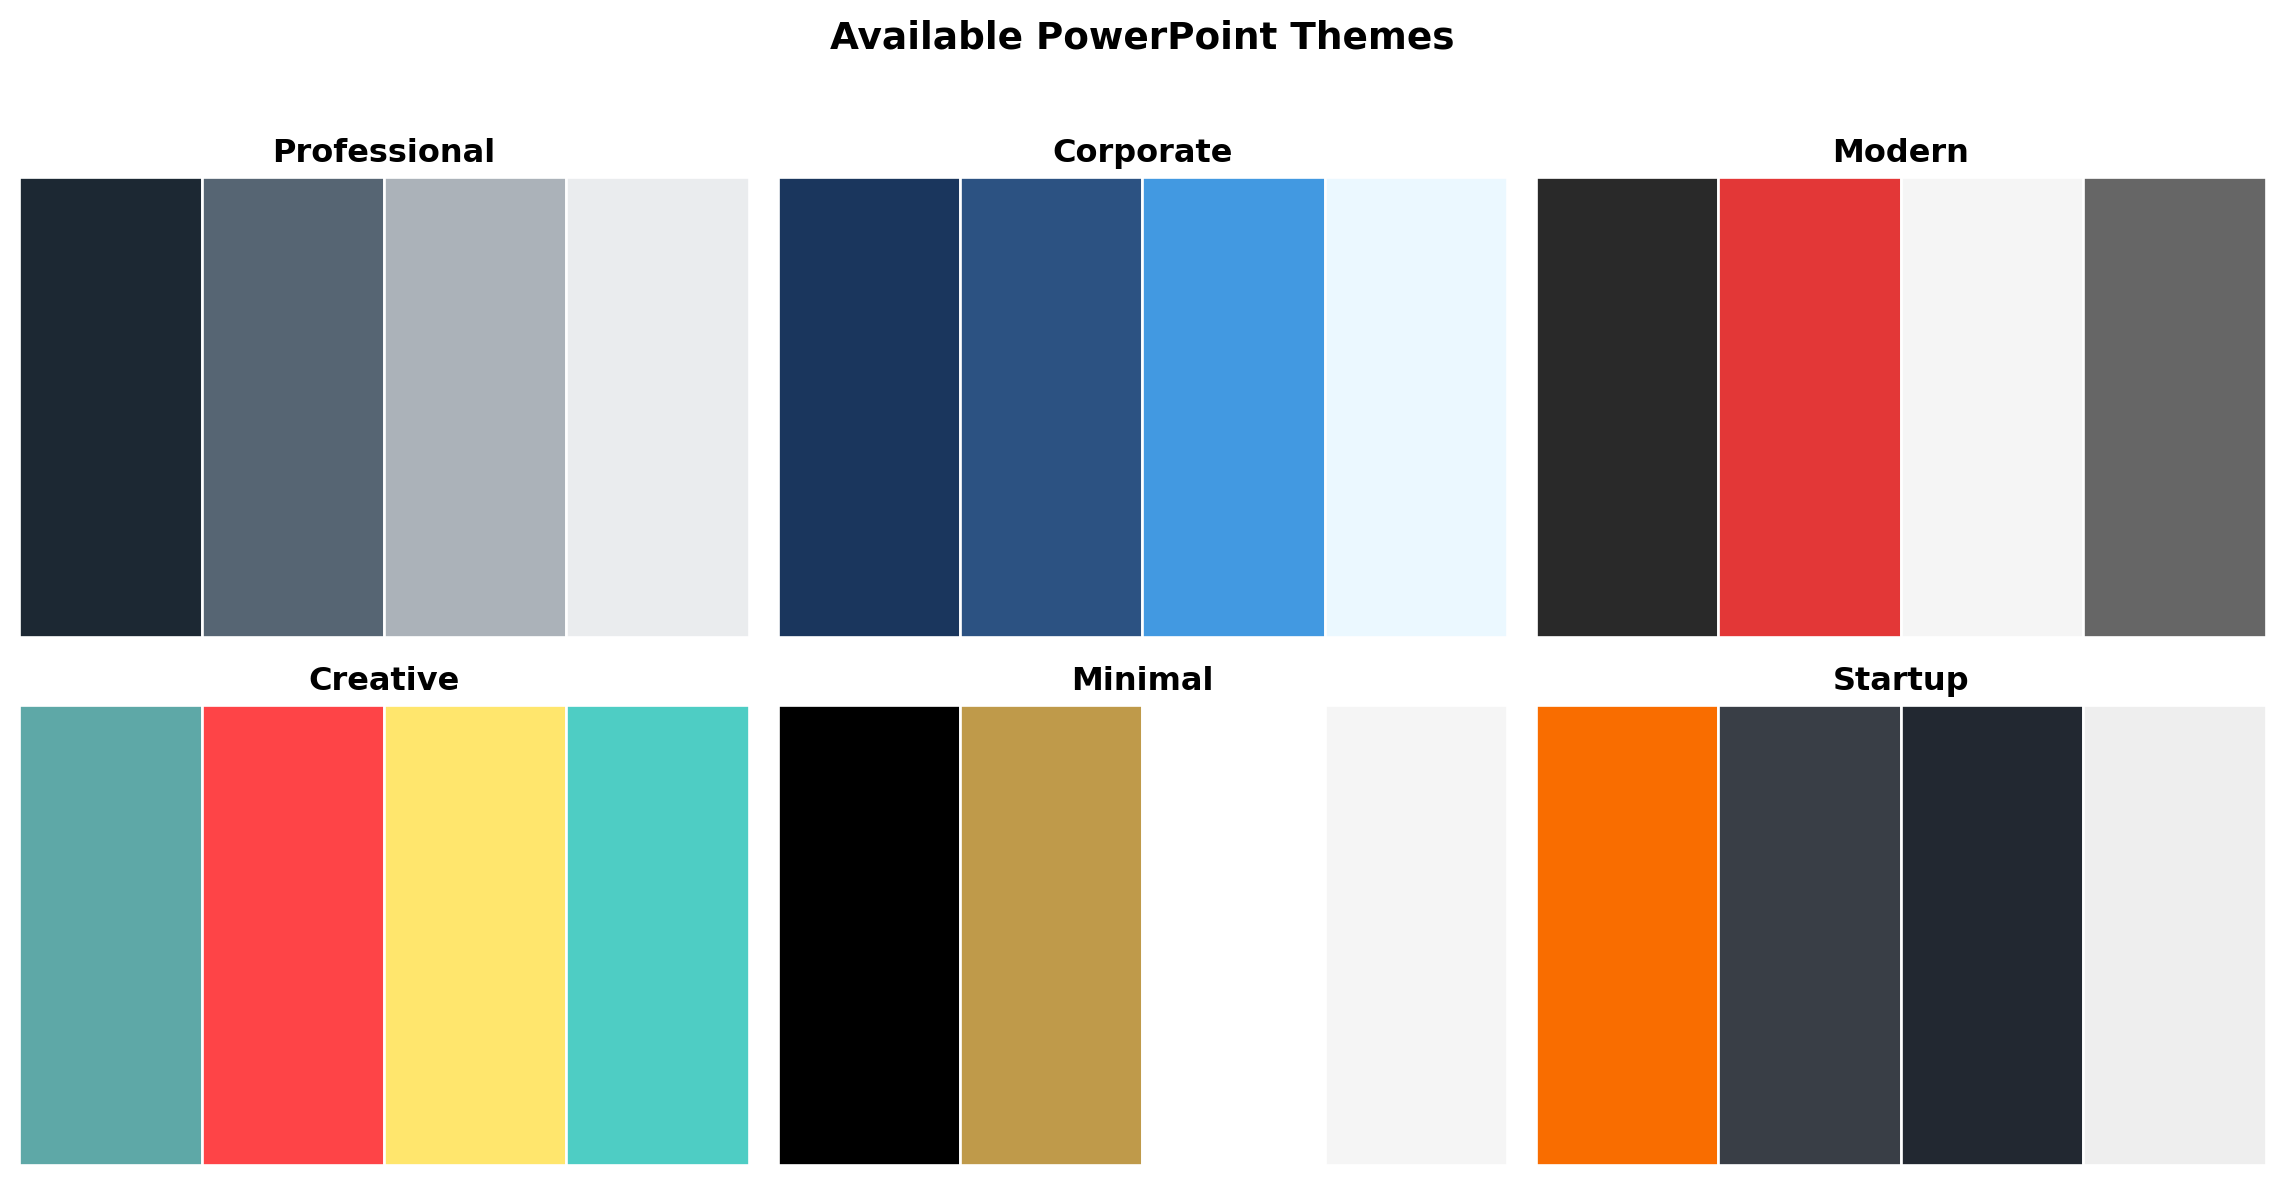
7.7 Workflow: End-to-End Automation
7.7.1 Complete Monthly Reporting Pipeline
7.7.2 The Pipeline Flow
flowchart TB
    subgraph Extract["1️⃣ EXTRACT"]
        PBI["📊 Power BI Query<br/><i>DAX → Raw Data</i>"]
    end

    subgraph Transform["2️⃣ TRANSFORM"]
        PARQ["📦 Save Parquet<br/><i>Archive & Speed</i>"]
        STATS["📈 Calculate Stats<br/><i>Aggregations</i>"]
    end

    subgraph Load["3️⃣ GENERATE"]
        XLSX["📗 Excel<br/><i>Data Analysis</i>"]
        DOCX["📘 Word<br/><i>Reports</i>"]
        PPTX["📙 PowerPoint<br/><i>Presentations</i>"]
    end

    PBI --> PARQ & STATS
    PARQ --> XLSX
    STATS --> XLSX & DOCX & PPTX

    style PBI fill:#3b82f6,color:white,stroke:#1e40af,stroke-width:2px
    style PARQ fill:#8b5cf6,color:white,stroke:#7c3aed
    style STATS fill:#f59e0b,color:white,stroke:#d97706
    style XLSX fill:#10b981,color:white,stroke:#059669
    style DOCX fill:#10b981,color:white,stroke:#059669
    style PPTX fill:#10b981,color:white,stroke:#059669
7.8 Essential Prompts for Brand Managers
7.8.1 Data Extraction
7.8.2 Data Transformation
7.8.3 Document Generation
7.9 Best Practices
7.9.1 File Organization
D:\Reports\
├── 2026\
│   ├── January\
│   │   ├── raw_data.parquet      # Archived source data
│   │   ├── monthly_report.xlsx   # Excel deliverable
│   │   ├── monthly_report.docx   # Word document
│   │   └── board_presentation.pptx
│   └── February\
│       └── ...
└── Templates\
    └── brand_guidelines.json     # Reusable formatting
7.9.2 Data Archival Strategy
TipAlways Save Raw Data
- Parquet for archival — Compressed, fast, preserves types
- Excel for sharing — Business users can open it
- CSV for integration — Universal compatibility
7.9.3 Performance Tips
| Scenario | Recommendation |
|---|---|
| Large datasets (>100K rows) | Use Parquet, not CSV |
| Multiple exports | Query once, export multiple formats |
| Regular reports | Save queries as templates |
| Team sharing | Use network paths or SharePoint |
7.10 Troubleshooting
WarningCommon Issues
“File is locked” - Close Excel/Word before overwriting - Use unique filenames with timestamps
“Query timeout” - Increase timeout_seconds parameter - Add filters to reduce data volume
“Invalid path” - Use double backslashes: D:\\Reports\\file.xlsx - Ensure directory exists
7.11 Summary
TipKey Takeaways
- Power BI MCP exports directly to CSV/Excel with one prompt
- MCP Stats DuckDB queries Parquet files 10-100x faster than loading CSVs
- Word generation creates professional reports with charts and tables
- PowerPoint generation builds presentations with modern visual elements
- Combine all tools for end-to-end automated reporting pipelines
The days of manual copy-paste reporting are over. One prompt can now: - Query your data warehouse - Transform and aggregate - Generate formatted Excel - Create Word reports - Build PowerPoint decks
That’s hours of clerical work reduced to minutes.