Breach Detection via Graph Clustering
A Case Study in Methodology Failure
We ran a fraud detection analysis on 5.7 million card transactions seeking triangulation fraud in travel bookings. The approach didn’t work as intended. What we found instead was more useful: a breach early-warning system that identifies compromised accounts before chargebacks surface.
1 Executive Summary
Graph triangle analysis in transaction data does not reliably identify fraud perpetrators. It identifies victims — and victim clustering patterns reveal breach characteristics with actionable precision.
The original objective was straightforward: build a graph of customer-merchant relationships, project it into customer-customer space, and search for triangles that might indicate coordinated fraud activity. We found 279 such triangles concentrated in travel merchants. The initial interpretation pointed toward a fraud ring operating through airline bookings and payment platforms.
That interpretation was wrong. What emerged instead was something more valuable — a methodology for detecting data breaches through the synchronised behaviour of their victims. The fraudsters themselves never appear in transaction data; they operate through stolen credentials. But victims cluster in predictable ways, and those clusters carry forensic information about the breach that compromised them.
This document traces that discovery.
2 Method
2.1 Graph Construction
The analysis began with one month of card transaction data: 5.7 million individual transactions involving 373,871 unique customers across 39 merchant categories. We represented this as a bipartite graph — two distinct vertex types (customers and merchants) connected by weighted edges representing transaction volume.
| Component | Count |
|---|---|
| Customer vertices | 373,871 |
| Merchant categories | 39 |
| Edges (transactions) | 882,511 |
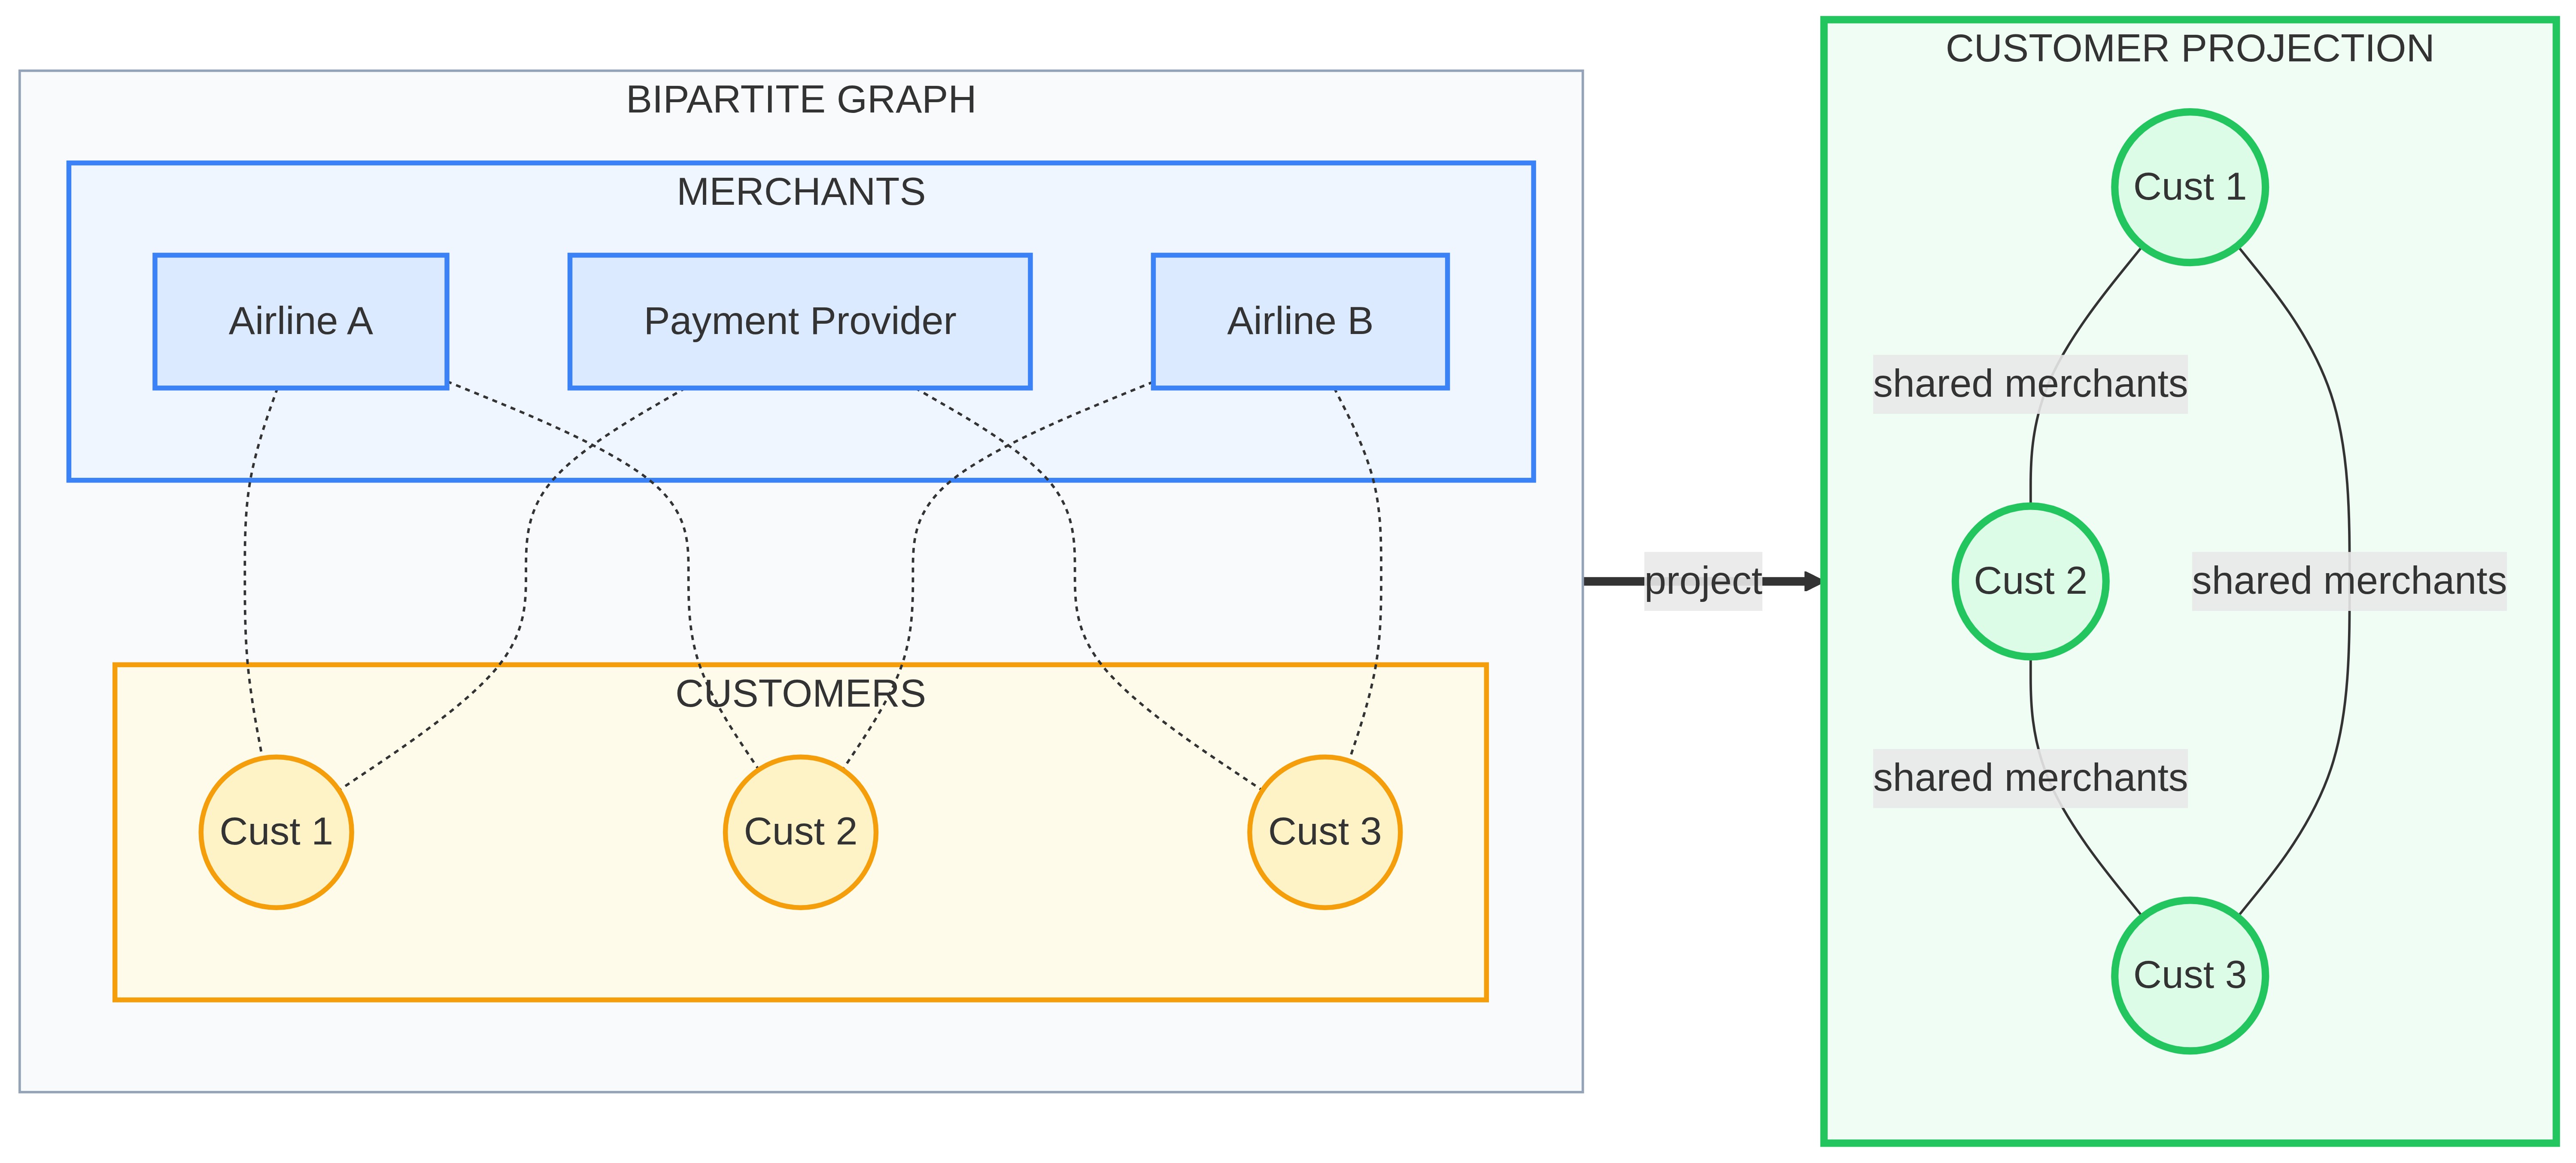
The bipartite structure captures who shops where, but not how customers relate to each other. To surface potential coordination, we projected the graph into customer-customer space. In this projection, two customers become connected if they share merchants above a specified threshold. We required at least three transactions at each shared merchant, and at least three shared merchants between any pair of customers. These parameters filter out coincidental overlap while preserving meaningful behavioural similarity.
2.2 Why Triangles Matter
In the projected customer graph, a triangle forms when three customers are all mutually connected — meaning each pair shares enough merchants to exceed our threshold. Under the fraud ring hypothesis, triangles indicate coordination: three actors working together, using the same infrastructure, leaving correlated traces.
The logic is probabilistic. Normal customers have idiosyncratic spending patterns shaped by individual preferences, geography, and circumstance. One person flies SAS because of loyalty points; another uses Norwegian because it serves their local airport. These patterns rarely overlap precisely. When three customers all share the exact same combination of travel merchants — and transact within the same time window — coincidence becomes unlikely. Coordination becomes plausible.
2.3 Initial Findings
The enumeration returned 279 triangles, concentrated heavily in travel-related merchants: two domestic airlines, a major payment platform, a hotel chain, and a rideshare service. The structure appeared to match classic fraud ring topology.
| Role | Characteristic | Observed Value |
|---|---|---|
| Hub | High degree centrality | 0.29 |
| Whale | Large single transaction | ~35,000 currency units |
| Mules | Low average transaction | ~80 currency units |
One customer node showed unusually high connectivity — degree centrality of 0.29, meaning direct connections to nearly a third of all suspicious accounts. This “hub” pattern typically indicates a coordinator or shared resource. Another node showed a single large transaction exceeding 35,000 currency units, consistent with a high-value extraction. Several others showed low-value, high-frequency patterns averaging around 80 currency units per transaction — the signature of “mules” who move money in small increments.
Community detection via the Louvain algorithm identified 13 distinct clusters within the suspicious population. The largest cluster contained 21 customers, all connected through the central hub node. Modularity of 0.66 suggested meaningful community structure rather than random connectivity.
At this point, the analysis appeared successful. We had identified a probable fraud ring, characterised its structure, and isolated its key participants.
Then we checked the previous year’s data.
3 The Anomalies
3.1 First Anomaly: The Ring That Didn’t Exist
Comparative analysis against the previous year revealed that the “fraud ring” did not exist 12 months prior.
Any persistent fraud operation should leave traces across time. Rings evolve — members rotate, tactics shift — but core relationships typically persist. We ran identical analysis on January of the previous year, expecting to find the same triangle structure in an earlier form.
The results were disorienting.
| Metric | Prior Year | Current Year |
|---|---|---|
| Suspicious customers | 82 | 83 |
| Triangles | 3,053 | 279 |
| Customer overlap | — | 3 |
The 3D graph above illustrates the density difference between periods. Toggle between Current Year (sparse, 279 triangles) and Prior Year (dense, 3,053 triangles). Green nodes represent triangle members; yellow nodes are other suspicious accounts. Drag to rotate, scroll to zoom.
The prior year showed 3,053 triangles — eleven times more than the current year — among a nearly identical count of suspicious customers. Yet only three customers appeared in both periods. The populations were almost entirely different.
This pattern contradicts every model of persistent fraud activity. A ring doesn’t replace 97% of its membership in twelve months while maintaining operations. Something else was happening.
Closer examination of the prior year’s dense triangle structure revealed its nature: corporate travel cohorts. Employees of the same company, booking through the same travel management system, using the same preferred airlines and hotel chains. They formed dense triangles because their behaviour was genuinely coordinated — by corporate policy, not criminal intent. The 3,053 triangles were legitimate.
The current year’s sparse 279 triangles were the actual anomaly. Not a stable fraud ring, but something that appeared suddenly in accounts that had previously shown no connection to each other.
3.2 Second Anomaly: Simultaneous Activation
We traced the transaction history of each triangle member backward through the preceding twelve months. The question was simple: when did these accounts first qualify as “travel-suspicious” under our threshold criteria?
All three core members crossed the threshold within a five-day window — after 12 months of stable, unremarkable activity.
The patterns before that window told a consistent story. One account showed monthly subscription payments of approximately 50 currency units, steady for a full year — the signature of a streaming service or software subscription. Another showed regular business travel: predictable airline bookings, consistent with someone who flies for work. The third displayed typical consumer behaviour: food delivery, occasional rideshare, retail purchases.
None of these accounts had any prior connection to each other. None showed travel patterns that would link them. Then, within five days in January, all three simultaneously began exhibiting the merchant combination that flagged them as suspicious.
Fraud rings don’t form this way. Compromised accounts do.
3.3 Third Anomaly: The Testing Signature
The transaction that confirmed the hypothesis appeared six days before the travel bookings began.
One account recorded 17 identical payment platform transactions on the same day, each for approximately 50 currency units. The amount was not arbitrary. It matched — to the decimal — the recurring subscription that account holder had been paying monthly for the previous year.
This is card validation behaviour, executed with unusual sophistication. When fraudsters obtain stolen card numbers, they must verify which cards remain active before attempting high-value extraction. The standard approach is small test transactions: amounts low enough to avoid fraud triggers, common enough to blend with normal activity.
But this attacker went further. They didn’t just pick a plausible amount — they used the victim’s own transaction history to select a camouflage amount. Seventeen cards tested in one session, each test disguised as a subscription renewal. To automated fraud detection systems, these transactions looked indistinguishable from legitimate recurring payments.
Four days after the testing session, seven flight bookings appeared across two airlines, totalling approximately 12,000 currency units. The validated cards were being monetised.
4 Cluster Analysis
The triangle we had identified was not isolated. We expanded the search to find all accounts that crossed the travel-suspicious threshold during the same January window.
Eight customers qualified within a six-day span. All showed the same merchant pattern: payment platform plus domestic airlines. All had established transaction histories of seven to twelve months — these were not newly created accounts or synthetic identities. None showed the card-testing signature that appeared on the index account; only that one account bore the distinctive 17-identical-transactions pattern.
All eight were victims of the same card dump, not participants in a fraud ring.
The classification followed from the evidence. The index account’s card had been used to test multiple stolen cards. The seven other accounts were those cards — their credentials harvested in the same breach, their numbers validated in the same session, their value extracted through the same airline booking scheme.
The triangle structure we observed wasn’t coordination among criminals. It was correlation among victims. They appeared connected because the same attacker compromised them, tested them together, and monetised them through identical methods within the same operational window.
5 Breach Source Attribution
If these eight accounts shared a common breach source, that source should appear in their pre-attack transaction history. We calculated merchant enrichment ratios: for each merchant, we compared frequency in the victim pool against frequency in the general population. A merchant appearing disproportionately among victims — relative to their overall prevalence — suggests involvement in the breach.
| Merchant | Victims | Population | Enrichment Factor |
|---|---|---|---|
| Retail/Payment Integration | 30% | 0.5% | 15.3× |
| E-commerce Platform | 50% | 4.3% | 2.5× |
| Domestic Airline | 50% | 9.1% | 1.5× |
One merchant stood out dramatically. A specific retail payment integration — used by only 1,967 customers in our entire database — appeared in 30% of victim accounts. The enrichment factor of 15.3× indicates that victims were fifteen times more likely to have used this merchant than the general population.
All three victims who used this integration did so during the fourth quarter of the previous year, in the months immediately preceding the January attack. The timing aligned precisely with the breach-to-exploitation window typical of card compromise: credentials stolen in autumn, sold or accumulated over winter, monetised in the new year.
The breach source was not visible in the fraud transactions. It was in the pre-fraud shopping history.
The fraud transactions showed only the extraction phase — airlines booked with stolen cards. The actual compromise had occurred months earlier, at a merchant the victims had used for legitimate purchases. The graph analysis, by identifying victims and enabling enrichment calculations, pointed backward in time to a breach that might otherwise have gone undetected.
6 Revised Interpretation
The original hypothesis held that triangles in transaction graphs indicate criminal coordination — three actors working together leave correlated traces. The evidence supports a different model.
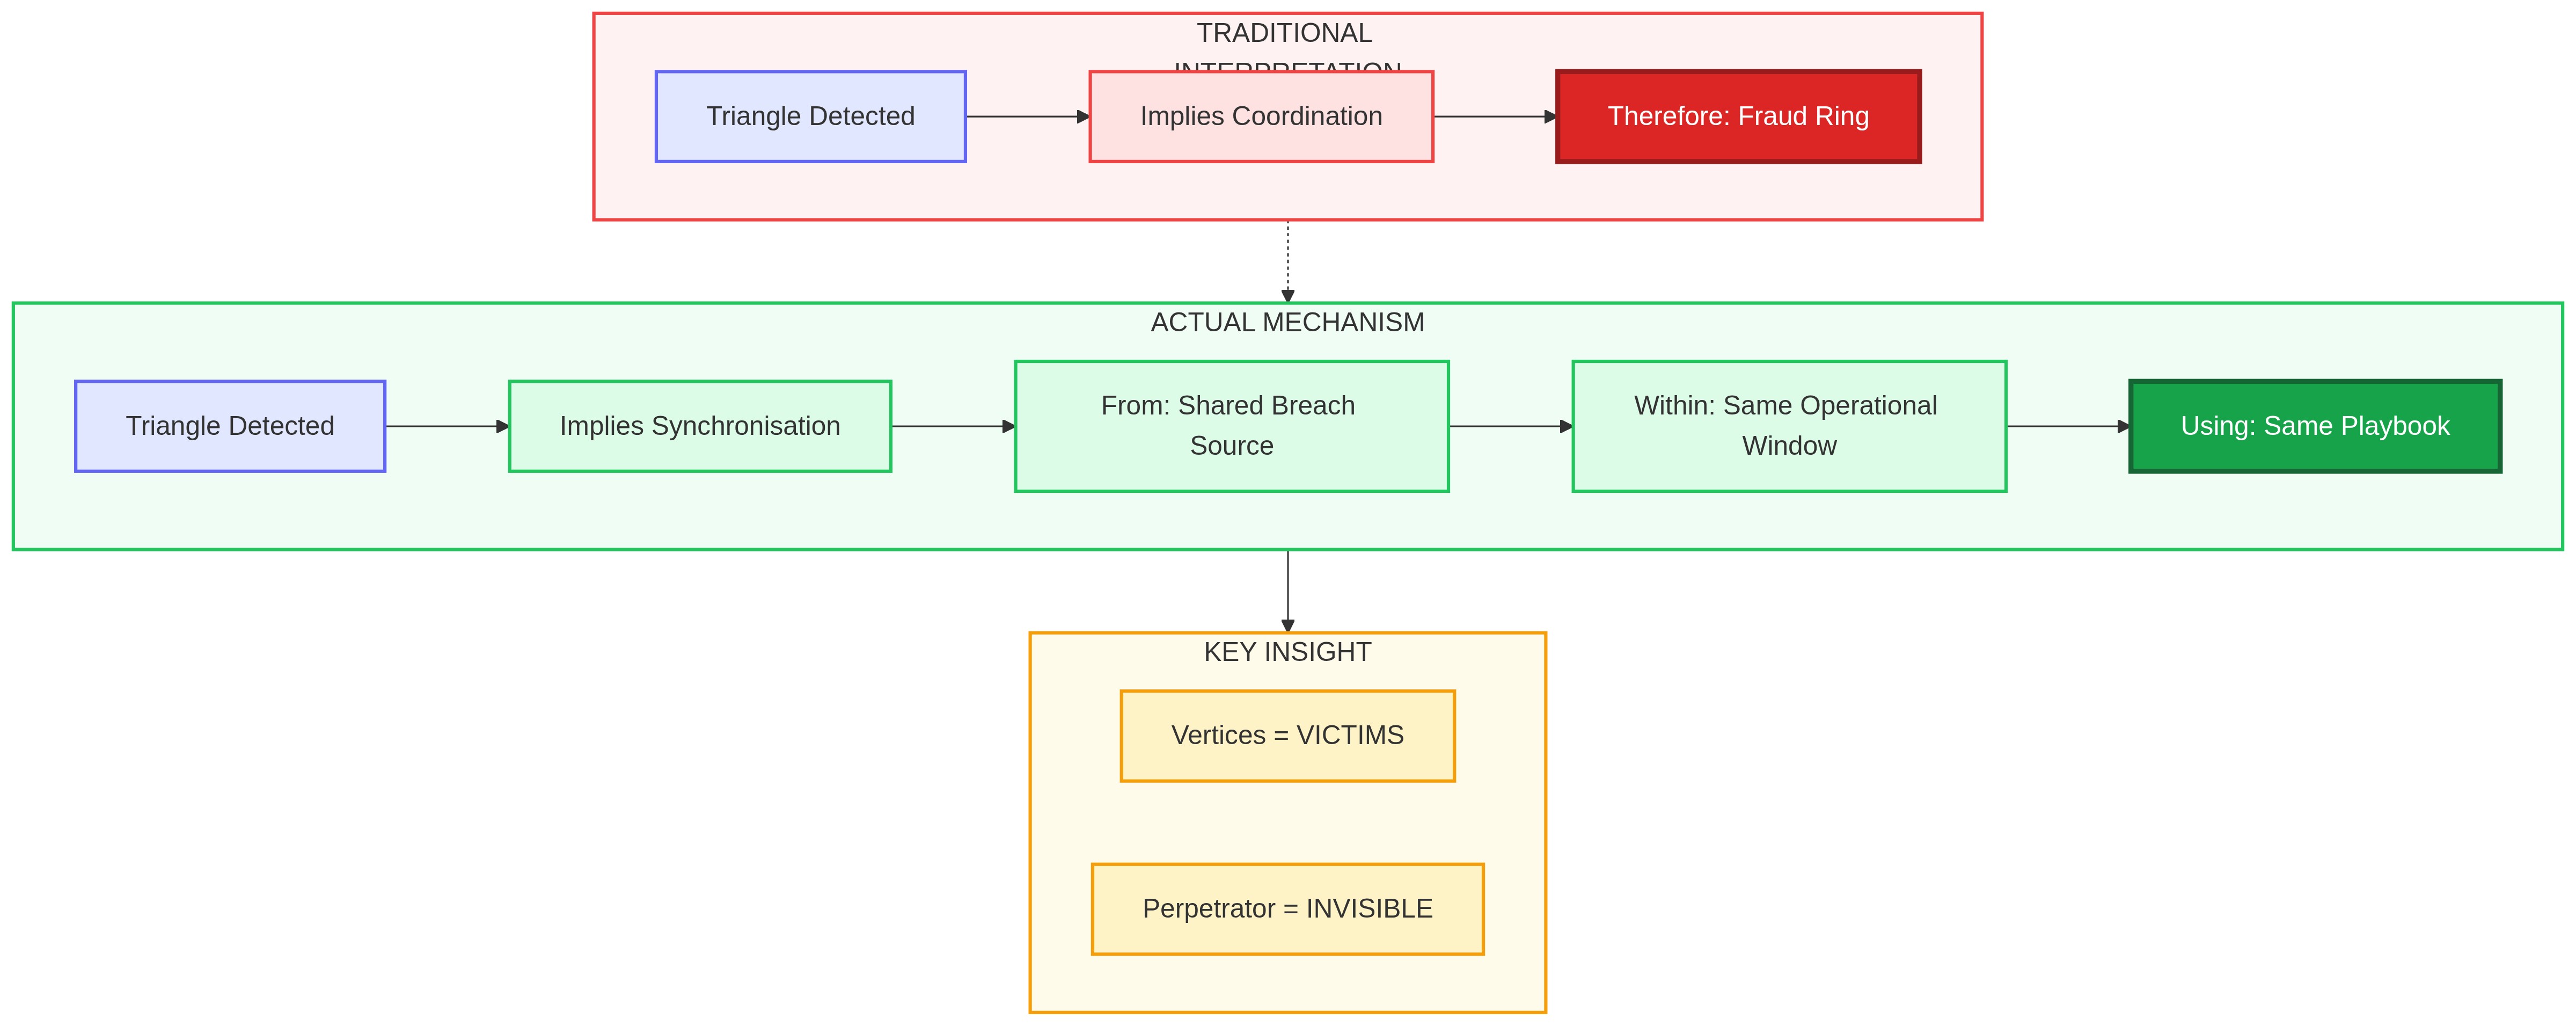
Triangles form when customers exhibit similar merchant patterns within similar time windows. This can happen through coordination — a fraud ring sharing infrastructure. But it also happens through synchronised victimisation: multiple accounts compromised in the same breach, exploited by the same attacker, within the same operational window, using the same monetisation playbook.
The second mechanism produces triangles that look identical to the first. The difference is that the actors represented by the triangle vertices are victims, not perpetrators. The perpetrator is absent from the graph entirely. They used stolen credentials to make purchases; their own accounts remain clean and unconnected.
Card-not-present transactions occur when the physical card isn’t presented to the merchant — online purchases, phone orders, or app payments. The cardholder (or fraudster) types in the card number rather than swiping, inserting, or tapping.
| Card-Present | Card-Not-Present |
|---|---|
| Physical card required | Only card number, expiry, CVV needed |
| Chip/PIN validates authenticity | No hardware verification possible |
| Fraudster must possess the card | Fraudster only needs stolen credentials |
| Lower fraud rates | Higher fraud rates |
In CNP fraud, attackers obtain card numbers from breaches and use them remotely — booking flights, making purchases — without ever possessing the physical cards. This is why perpetrators remain invisible: the transaction data shows the victim’s card being used, not the fraudster’s identity.
This absence is the fundamental challenge of card-not-present fraud detection. The criminal’s identity never touches the transaction data. What does touch the data is the pattern of their operation: which cards they obtained together (from a common breach), which they validated together (in a testing session), which they monetised together (through a consistent playbook). Victims become the forensic evidence of attacks perpetrated against them.
The graph structure captures this evidence. Triangle density over time functions not as a coordination metric but as a breach severity indicator. Merchant enrichment among triangle members points toward breach sources. The timing of triangle formation reveals operational windows. The methodology finds victims, and victims are informative.
7 Operationalised Detection Rules
The revised interpretation suggests three detection rules, each targeting a different phase of the attack lifecycle.
7.1 Rule 1: Cluster Activation
IF: ≥5 customers cross travel-suspicious threshold
WITHIN: 7-day window
SHARING: ≥3 merchants
THEN: Alert — potential breach, investigate common exposure
Synchronous activation of previously unconnected accounts indicates a shared compromise event. The 7-day window and 5-account threshold are calibrated to exceed baseline activation rates while remaining sensitive to medium-sized breaches. When triggered, the response is not to investigate the accounts as fraud suspects but to search their pre-activation history for common merchants — the probable breach source.
7.2 Rule 2: Card Testing Pattern
IF: ≥5 identical transaction amounts (±1%)
ON: Same day
IN: Subscription price range (40-60 currency units)
THEN: Alert — card validation activity detected
Mass card testing leaves a distinctive trace: multiple identical transactions at amounts designed to evade detection. The subscription price range (40-60 currency units) represents the sweet spot where test transactions can masquerade as recurring payments. Detection at this phase — before monetisation — enables intervention while stolen cards still have value to the attacker.
7.3 Rule 3: Camouflage Detection
IF: Test transaction amount matches account's own recurring payment
THEN: Escalate — sophisticated attacker with transaction log access
When test amounts precisely match an account’s established payment patterns, the attacker has demonstrated access to transaction history, not merely card numbers. This indicates compromise at a deeper level: a payment processor, a merchant with stored transaction logs, or a breach that included behavioural data alongside credentials. Such breaches warrant elevated response and broader investigation.
Rule 3 indicates the attacker had access to more than just card numbers — they had visibility into transaction history, suggesting a deeper compromise at the payment processor or merchant level.
8 Attack Timeline Reconstruction
Synthesising the evidence allows reconstruction of the complete attack timeline, from initial compromise through detection.
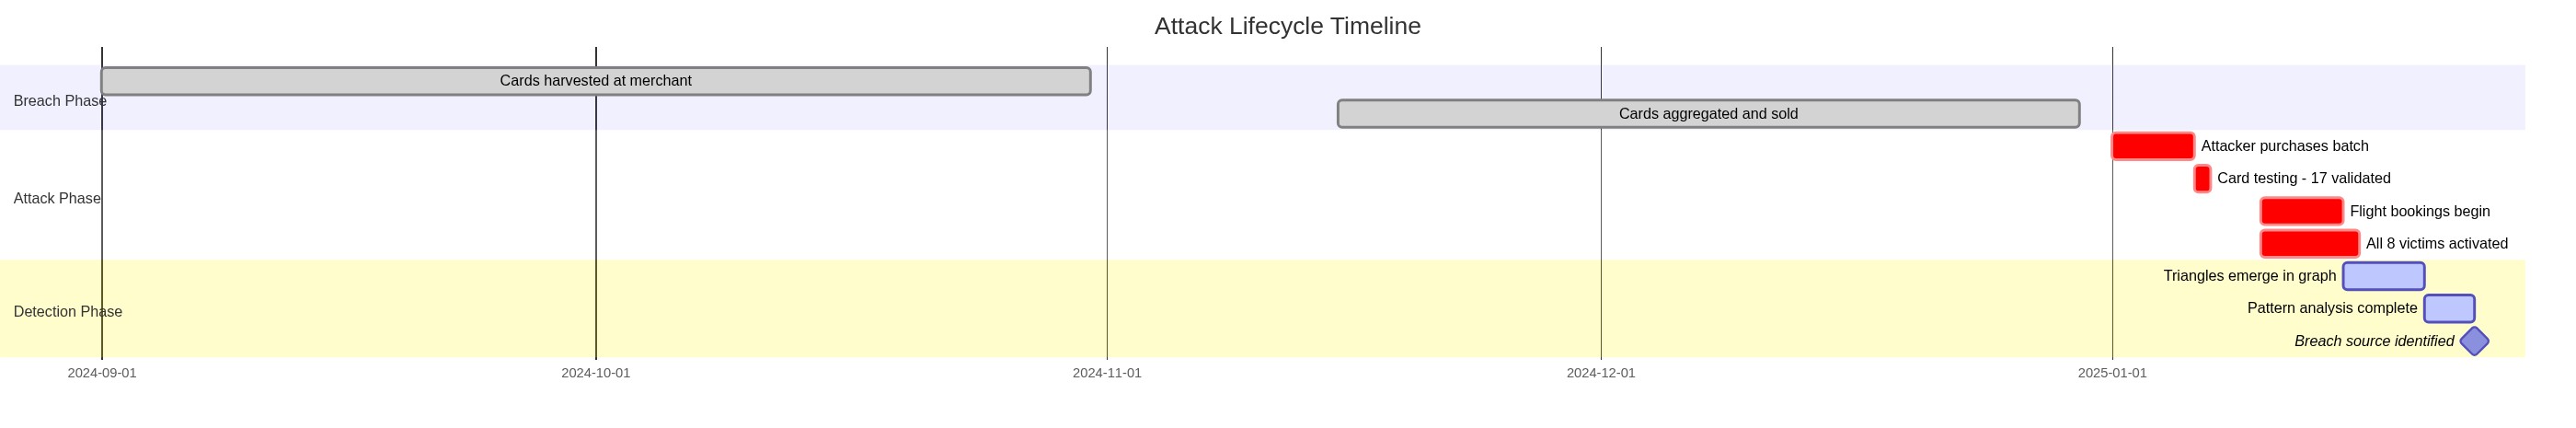
The breach itself occurred in autumn — likely September through October — when victims used the compromised retail payment integration. Card details were harvested, accumulated, and eventually sold or transferred to the operational attacker. A quiet period followed as the cards moved through underground markets.
In early January, the attacker acquired a batch of cards from this breach. Testing began on January 6th: seventeen identical transactions designed to validate which cards remained active. Cards that cleared the test moved to monetisation; cards that failed were discarded. Four days later, on January 10th, flight bookings began. Over the following week, eight victim accounts showed the characteristic travel pattern that triggered our detection threshold.
The triangle structure formed not from conspiracy but from shared victimhood. Detection occurred weeks before chargebacks would have surfaced — the typical chargeback window is 30-60 days, but graph analysis identified the cluster within ten days of the first fraudulent booking.
9 Conclusion
Graph triangle analysis in transaction data does not reliably identify fraud perpetrators. Perpetrators use others’ credentials and remain invisible.
The method does identify victims, and victim clustering patterns reveal breach characteristics: timing, scope, monetisation strategy, and probable source.
The investigation began with a conventional fraud detection objective: identify coordinated criminal activity through graph topology. That objective was not achieved. The methodology found triangles, but the triangles did not represent what we expected.
What the methodology actually produces is a breach early-warning system. It detects compromise events through their downstream effects — the synchronised appearance of victim accounts in merchant overlap graphs. Because victims share breach source, attacker, and operational timeline, they cluster in ways that distinguish them from legitimate customers. The clusters form before chargebacks surface, before most victims notice unauthorised transactions, before the breach becomes public knowledge.
The practical value of this reframing is significant. Traditional fraud detection seeks perpetrators, who are difficult to identify because they operate through stolen identities. Breach detection seeks victims, who are identifiable because their behaviour reflects the attack conducted against them. The same graph structure supports both objectives, but the interpretation determines what actions follow.
Triangle density over time becomes a breach severity indicator: rising density suggests active exploitation of compromised credentials. Merchant enrichment among triangle members points toward breach sources: the merchant appearing disproportionately in victim histories is likely where credentials were stolen. Formation timing reveals attacker operational patterns: the gap between testing and monetisation, the duration of extraction campaigns, the indicators of professional versus opportunistic fraud.
The methodology failed at its stated objective. What it produced instead was more useful. This outcome suggests a broader lesson for analytical work: methods often reveal something other than what they were designed to find. The discipline is recognising when that something is valuable.
10 Appendix: Technical Implementation
10.1 Tools Used
The analysis was conducted using Model Context Protocol (MCP) servers — specialised toolkits that provide domain-specific analytical capabilities through a standardised interface. MCP enables conversational data analysis: the entire investigation proceeded through natural language dialogue, with each analytical step executed via tool calls. No manual scripting was required; the process remains reproducible and auditable through the conversation record.
| Component | MCP Server | Capabilities Used |
|---|---|---|
| Graph analysis | MCP iGraph | Bipartite construction, projection, triangle enumeration, Louvain community detection, centrality metrics |
| Data queries | MCP Statistics | DuckDB-powered Parquet queries, SQL window functions, aggregation pipelines |
| Enrichment analysis | MCP Statistics | Population statistics, ratio calculations, cross-tabulation |
| Timeline analysis | MCP Statistics | Time series windowing, temporal pattern detection |
MCP servers enable conversational data analysis — the entire investigation was conducted through natural language dialogue with an AI assistant, with no manual scripting required. Each analytical step was executed via tool calls, making the process reproducible and auditable.
10.2 Analysis Pipeline
The investigation followed a sequence of MCP tool invocations, each building on results from the previous step.
Data extraction began with SQL queries against Parquet transaction files, executed through MCP Statistics. The queries selected January transactions, aggregated by customer and merchant, and computed edge weights representing transaction counts. The resulting edge list — 882,511 rows linking customers to merchants — formed the input for graph construction.
Graph construction proceeded through MCP iGraph. The bipartite graph was instantiated with 373,871 customer vertices and 39 merchant vertices, edges weighted by transaction volume. Projection to customer-customer space applied the threshold criteria: customers became connected if they shared at least three merchants with at least three transactions each. The projected graph was substantially smaller — most customers share few or no merchants above threshold — enabling efficient triangle enumeration.
Triangle enumeration identified 279 triangles in the current period. For comparison, we constructed an identical graph from the prior year’s January data; that graph yielded 3,053 triangles, prompting the investigation into why the structures differed so dramatically.
Community detection applied the Louvain algorithm to the projected graph, identifying 13 communities with modularity 0.66. Centrality metrics — degree, betweenness, eigenvector — characterised node importance within each community. These metrics initially supported the fraud ring interpretation; reinterpretation as victim clusters came later.
Enrichment calculation returned to MCP Statistics for population-normalised merchant frequency analysis. SQL queries computed merchant usage rates among victim accounts versus the general population, yielding enrichment factors that identified the probable breach source.
10.3 Key MCP iGraph Operations
Graph Construction Sequence
# Step 1: Create bipartite graph
mcp_igraph: create_bipartite
  vertices_type1: [customer_ids]        # 373,871 customers
  vertices_type2: [merchant_categories] # 39 categories
  edges: [customer, merchant, weight]   # 882,511 weighted edges

# Step 2: Project to customer-customer space
mcp_igraph: bipartite_projection
  mode: "one"          # Project to customer vertices
  multiplicity: true   # Preserve edge weights

# Step 3: Find triangles
mcp_igraph: list_triangles
  Result: 279 triangles in current period
  Result: 3,053 triangles in prior period (comparison)

# Step 4: Community detection
mcp_igraph: community_louvain
  Result: 13 communities detected
  Result: Modularity 0.66
10.4 45 Minutes: From Raw Data to Breach Detection
This entire investigation — from loading 5.7 million transactions to identifying the breach source — took 45 minutes. No Jupyter notebooks. No cluster provisioning. No waiting for Spark jobs. Just conversation.
A natural question arises: with 373,871 customers and 882,511 transaction edges, how does this analysis remain tractable on standard hardware? The answer lies in our “Filter First, Graph Second” strategy, executed through conversational AI.
The raw transaction data presents a dense bipartite graph — every customer who ever bought anything connects to one or more merchants. But our detection logic requires unusual overlap: customers sharing three or more merchants, each with three or more transactions. This threshold eliminates coincidental connections and reduces the graph from hundreds of thousands of vertices to fewer than a hundred suspicious accounts.
| Stage | Vertices | Edges | Reduction |
|---|---|---|---|
| Raw transactions | 373,871 | 882,511 | — |
| After projection threshold | ~2,000 | ~8,000 | 99.5% |
| Travel-suspicious subset | 83 | 279 triangles | 99.98% |
The heavy lifting happens in SQL, executed against Parquet files via DuckDB. Aggregation, threshold filtering, and temporal windowing all occur before any graph is constructed. By the time the graph analytics layer receives the edge list, it’s working with a focused subgraph small enough for instantaneous triangle enumeration and community detection.
This pattern — SQL for filtering and aggregation, graph analytics for structural queries — reflects production best practices. But the real innovation is how we accessed these capabilities.
10.5 The Querex Approach: Mathematical Tools for the Speed of Thought
Querex AS builds mathematical infrastructure that enables Large Language Models to interact with data through sound, auditable analytical tools. Our MCP (Model Context Protocol) suite transforms complex analytical workflows into natural conversation.
Forget Jupyter notebooks. Forget massive compute clusters. Forget weeks of development time.
All you need is your machine, your data, and your ideas. The mathematical reasoning — we take care of that.
This case study was conducted using the Querex MCP Suite, which provides:
| Component | Capability | Used In This Analysis |
|---|---|---|
| MCP iGraph | Graph construction, projection, triangle enumeration, community detection | Fraud ring topology analysis |
| MCP Statistics | SQL on Parquet, statistical testing, enrichment analysis | Data filtering, merchant attribution |
| MCP Quantitative | Financial risk modelling, portfolio analytics | Transaction pattern analysis |
| Enterprise LLM Endpoint | Secure, auditable AI reasoning | Conversational orchestration |
The entire investigation proceeded through natural language dialogue. Each analytical step — graph construction, triangle enumeration, community detection, enrichment calculation — was executed via tool calls that the LLM orchestrated based on the evolving investigation. No code was written. No notebooks were configured. The analyst asked questions; the system provided mathematically rigorous answers.
Who benefits from this approach?
- The bank CEO who needs to understand breach exposure without waiting for a technical report
- The quantitative analyst who can iterate through hypotheses at conversation speed rather than development speed
- The fraud investigator who can follow hunches immediately rather than queuing requests to a data team
- The risk committee that can explore scenarios in real-time during meetings
The 32GB RAM once considered “high-end” for notebooks is rapidly becoming baseline. Workstations with 64-128GB unified memory are increasingly common. What required distributed clusters five years ago increasingly fits on a single powerful notebook — especially when intelligent filtering reduces problem size before computation begins.
10.6 When You Need More: The Scaling Landscape
For truly massive graphs — billions of edges, real-time streaming requirements — the Querex approach scales with you:
| Scale | Querex Solution | Architecture |
|---|---|---|
| < 10M edges | Querex MCP Suite | Your laptop, conversational analysis |
| 10M – 100M edges | Querex MCP Suite + NetworKit | Single server, batch + interactive |
| 100M – 1B edges | Querex Enterprise (cuGraph) | GPU cluster in your network |
| > 1B edges | Querex Enterprise (Multi-GPU) | Distributed GPU infrastructure |
For banks and financial institutions processing billions of transactions, we deploy cuGraph-powered GPU clusters on your premises or private cloud. The infrastructure sits inside your network perimeter — your data never leaves. But the interface remains the same: natural conversation.
The CEO asks a question. The LLM orchestrates the query. cuGraph processes billions of edges in seconds. The answer returns in plain language.
Same conversation. Enterprise scale. Your security boundaries.
Our fraud detection scenario sits comfortably in the first tier. After SQL filtering, we work with graphs of hundreds to thousands of vertices — ideal for conversational analysis on standard hardware. But the methodology’s power comes not from computational muscle but from the insight that victims cluster predictably.
For organisations processing billions of daily transactions, the same methodology applies — and the same conversational interface. The “Filter First, Graph Second” principle remains constant; the Querex MCP Suite handles the analytical layer; our enterprise deployments simply swap the backend from CPU to GPU without changing how analysts interact with the system.